Multiple Choice
Exhibit 3-13 Supply and demand curves 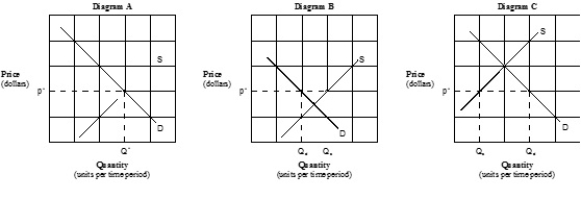
- Which of the graphs in Exhibit 3-13 illustrates a shortage exists at the indicated market price?
A) Diagram A.
B) Diagram B.
C) Diagram C.
D) Diagrams A and B.
Correct Answer:

Verified
Correct Answer:
Verified
Q1: All of the following apply to the
Q1: When economists say the supply of a
Q2: Other things being equal, the effect of
Q4: The law of demand states that, ceteris
Q7: Exhibit 3-3 Demand curves <img src="https://d2lvgg3v3hfg70.cloudfront.net/TB6121m/.jpg" alt="Exhibit
Q8: Assuming that hamburgers and hot dogs are
Q10: Two goods that are complementary are:<br>A) wrapping
Q11: Assume that crackers and soup are complementary
Q18: When economists say the quantity demanded of
Q166: Assume Q<sub>s</sub> represents the quantity supplied at