Multiple Choice
Exhibit 3-4 Supply curves 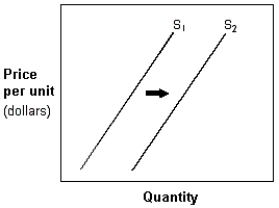
-In Exhibit 3-4, a shift in the supply curve from S1 to S2 represents a(n) :
A) decrease in supply.
B) decrease in the quantity supplied.
C) increase in supply.
D) increase in the quantity supplied.
E) increase in demand.
Correct Answer:

Verified
Correct Answer:
Verified
Related Questions
Q354: If pork and beans is an inferior
Q355: Assume that brand X is an inferior
Q356: If the current market price is above
Q357: If good X is an inferior good,
Q358: A demand curve:<br>A) has a positive slope.<br>B)
Q360: Exhibit 3A-1 Comparison of Market Efficiency and
Q361: A reduction in production costs will result
Q362: If the demand for a good increases
Q363: Other things being equal, an increase in
Q364: Exhibit 3A-2 Comparison of Market Efficiency and