Multiple Choice
Exhibit 3A-2 Comparison of Market Efficiency and Deadweight Loss 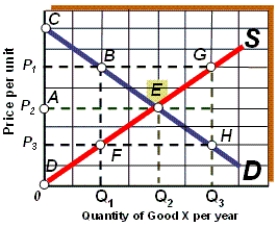
-As shown in Exhibit 3A-2, if the quantity supplied of good X per year is Q1, the result is:
A) deadweight loss.
B) inefficiency.
C) underproduction.
D) all of the above are true.
E) none of the above are true.
Correct Answer:

Verified
Correct Answer:
Verified
Q13: An increase in demand:<br>A) results in a
Q134: Supply curves slope upward because:<br>A) the quality
Q149: According to the law of supply,<br>A) more
Q359: Exhibit 3-4 Supply curves <img src="https://d2lvgg3v3hfg70.cloudfront.net/TB6121m/.jpg" alt="Exhibit
Q360: Exhibit 3A-1 Comparison of Market Efficiency and
Q361: A reduction in production costs will result
Q362: If the demand for a good increases
Q363: Other things being equal, an increase in
Q367: Exhibit 3-8 Demand and supply data
Q368: If there is an increase in income,