Multiple Choice
The following table shows the marginal products of capital (K) and labour (L) for various methods for Firm ABC to produce 1000 toys per day. 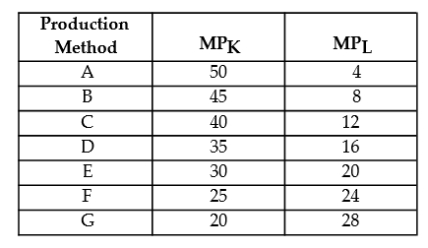 TABLE 8-2
-Refer to Figure 8-2. Increasing returns to scale occur over the output range
A) Q₂ to Q₃ only.
B) beyond Q₃ only.
C) 0 to Q₁ only.
D) Q₁ to Q₂ only.
E) 0 to Q₃ only.
Correct Answer:

Verified
Correct Answer:
Verified
Q8: A short- run average total cost curve
Q16: A downward- sloping LRAC curve will shift
Q17: Suppose that capital costs $8 per unit
Q29: A very- long- run consideration that could
Q51: The figure below shows a family of
Q59: If there is a fall in all
Q81: A profit- maximizing firm will increase its
Q91: The figure below shows the isocost lines
Q92: The following table shows the marginal
Q95: The figure below shows a family of