Multiple Choice
The figure below shows a family of cost curves for a firm. The subscripts 1, 2, and 3 for the SRATC curves refer to different plant sizes. 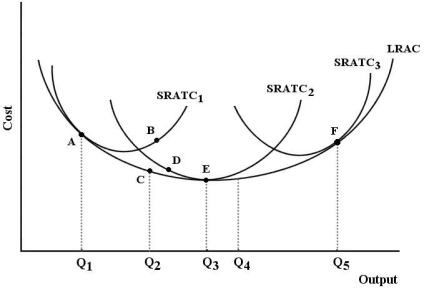 FIGURE 8-3
-Refer to Figure 8-3. The minimum efficient scale is achieved by this firm at output level
A) Q₃.
B) Q₄.
C) Q₂.
D) Q₁.
E) Q5.
Correct Answer:

Verified
Correct Answer:
Verified
Related Questions
Q4: In defining a firm's long- run average
Q8: A short- run average total cost curve
Q10: Suppose that capital costs $10 per unit
Q16: A downward- sloping LRAC curve will shift
Q29: A very- long- run consideration that could
Q51: The figure below shows a family of
Q66: The figure below shows the isocost lines
Q91: The figure below shows the isocost lines
Q92: The following table shows the marginal products
Q92: The following table shows the marginal