Multiple Choice
The diagram below shows a set of budget lines facing a household. 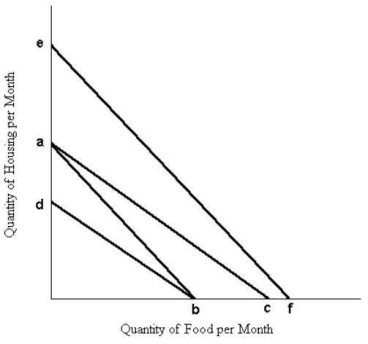 FIGURE 6-7
-Refer to Figure 6-6.
A) under the demand curve to the left of Q0, but above P0.
B) under the demand curve to the left of Q0.
C) under the entire demand curve.
D) above the market price.
E) below P0 and to the left of Q0.
Correct Answer:

Verified
Correct Answer:
Verified
Q11: Marginal utility analysis predicts a downward- sloping
Q14: Assume an individual with a downward- sloping
Q15: If a consumer is faced with a
Q60: In indifference curve analysis, a point to
Q88: The diagram below shows a set of
Q89: Suppose there are only two goods, A
Q95: A consumer maximizes his or her utility
Q97: If consumption of a product delivers a
Q106: Economists use the term "marginal utility" to
Q113: The substitution effect of a price change<br>A)