Short Answer
SCENARIO 2-10
The histogram below represents scores achieved by 200 job applicants on a personality profile.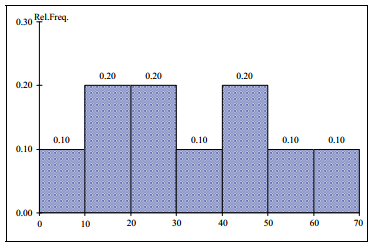
-Referring to the histogram from Scenario 2-10,the number of job applicants who scored 50 or above is_____ .
Correct Answer:

Verified
Correct Answer:
Verified
Q56: SCENARIO 2-14 <br>The table below contains the
Q57: A research analyst was directed to arrange
Q58: The main principle behind the Pareto chart
Q59: Given below is the scatter plot of
Q60: The original data values cannot be determined
Q62: SCENARIO 2-14 <br>The table below contains the
Q63: One of the developing countries is experiencing
Q64: When polygons or histograms are constructed,which axis
Q65: SCENARIO 2-10<br>The histogram below represents scores achieved
Q66: SCENARIO 2-1<br>An insurance company evaluates many numerical