True/False
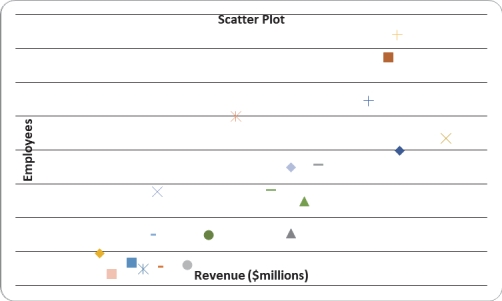
Given below is the scatter plot of the number of employees and the total revenue ($millions)of 20 U.S.companies.There appears to be a positive relationship between total revenue and the number of employees.
Correct Answer:

Verified
Correct Answer:
Verified
Q54: SCENARIO 2-2<br>2-2 Organizing and Visualizing Variables<br>At a
Q55: SCENARIO 2-7<br>The Stem-and-Leaf display below contains data
Q56: SCENARIO 2-14 <br>The table below contains the
Q57: A research analyst was directed to arrange
Q58: The main principle behind the Pareto chart
Q60: The original data values cannot be determined
Q61: SCENARIO 2-10<br>The histogram below represents scores achieved
Q62: SCENARIO 2-14 <br>The table below contains the
Q63: One of the developing countries is experiencing
Q64: When polygons or histograms are constructed,which axis