Short Answer
SCENARIO 2-10
The histogram below represents scores achieved by 200 job applicants on a personality profile.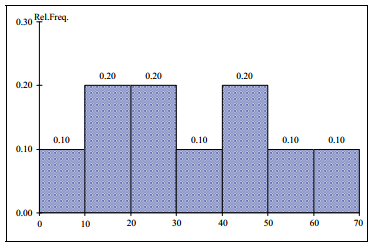
-Referring to the histogram from Scenario 2-10,half of the job applicants scored below_____ .
Correct Answer:

Verified
Correct Answer:
Verified
Related Questions
Q97: SCENARIO 2-8<br>The Stem-and-Leaf display represents the number
Q98: A polygon can be constructed from a
Q99: When you work with many variables,you must
Q100: SCENARIO 2-14 <br>The table below contains the
Q101: The sum of relative frequencies in a
Q103: Given below is the scatter plot of
Q104: When constructing charts,the following is plotted at
Q105: SCENARIO 2-5<br>The following are the duration in
Q106: SCENARIO 2-11<br>The ordered array below resulted from
Q107: SCENARIO 2-18<br>The stem-and-leaf display below shows the