menu-iconExamlexExamLexServices

Discover

Ask a Question
  1. All Topics
  2. Topic
    Statistics
  3. Study Set
    Basic Business Statistics Study Set 3
  4. Exam
    Exam 2: Organizing and Visualizing Variables
  5. Question
    Given Below Is the Scatter Plot of the Price/earnings Ratio
Solved

Given Below Is the Scatter Plot of the Price/earnings Ratio

Question 103

Question 103

True/False

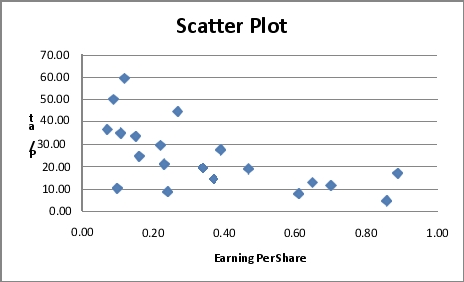
Given below is the scatter plot of the price/earnings ratio versus earnings per share of 20 U.S.companies.There appear to be a positive relationship between price/earnings ratio and earnings per share.

Correct Answer:

verifed

Verified

Unlock this answer now
Get Access to more Verified Answers free of charge

Related Questions

Q98: A polygon can be constructed from a

Q99: When you work with many variables,you must

Q100: SCENARIO 2-14 <br>The table below contains the

Q101: The sum of relative frequencies in a

Q102: SCENARIO 2-10<br>The histogram below represents scores achieved

Q104: When constructing charts,the following is plotted at

Q105: SCENARIO 2-5<br>The following are the duration in

Q106: SCENARIO 2-11<br>The ordered array below resulted from

Q107: SCENARIO 2-18<br>The stem-and-leaf display below shows the

Q108: SCENARIO 2-18<br>The stem-and-leaf display below shows the

Examlex

ExamLex

About UsContact UsPerks CenterHomeschoolingTest Prep

Work With Us

Campus RepresentativeInfluencers

Links

FaqPricingChrome Extension

Download The App

Get App StoreGet Google Play

Policies

Privacy PolicyTerms of ServiceHonor CodeCommunity Guidelines

Scan To Download

qr-code

Copyright © (2025) ExamLex LLC.

Privacy PolicyTerms Of ServiceHonor CodeCommunity Guidelines