True/False
SCENARIO 2-18
The stem-and-leaf display below shows the result of a survey on 50 students on their satisfaction with their school with the higher scores represent higher level of satisfaction.
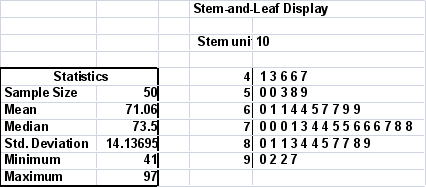
-Referring to Scenario 2-18,if a student is randomly selected,his/her most likely level of satisfaction will be in the 70s among the 40s,50s,60s,70s,80s and 90s.
Correct Answer:

Verified
Correct Answer:
Verified
Q1: Given below is the scatter plot of
Q2: SCENARIO 2-7<br>The Stem-and-Leaf display below contains data
Q3: SCENARIO 2-5<br>The following are the duration in
Q4: Apple Computer,Inc.collected information on the age of
Q5: SCENARIO 2-5<br>The following are the duration in
Q7: SCENARIO 2-4<br>A survey was conducted to determine
Q8: SCENARIO 2-9<br>The frequency distribution below represents the
Q9: To determine the width of class interval,divide
Q10: In graphing two categorical data,the side-by-side bar
Q11: SCENARIO 2-6<br>A sample of 200 students at