menu-iconExamlexExamLexServices

Discover

Ask a Question
  1. All Topics
  2. Topic
    Statistics
  3. Study Set
    Basic Business Statistics Study Set 3
  4. Exam
    Exam 2: Organizing and Visualizing Variables
  5. Question
    Given Below Is the Scatter Plot of the Market Value
Solved

Given Below Is the Scatter Plot of the Market Value

Question 1

Question 1

True/False

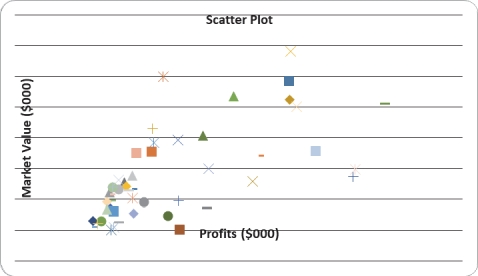
Given below is the scatter plot of the market value (thousands$)and profit (thousands$)of 50 U.S.companies.Higher market values appear to be associated with higher profits.

Correct Answer:

verifed

Verified

Related Questions

Q2: SCENARIO 2-7<br>The Stem-and-Leaf display below contains data

Q3: SCENARIO 2-5<br>The following are the duration in

Q4: Apple Computer,Inc.collected information on the age of

Q5: SCENARIO 2-5<br>The following are the duration in

Q6: SCENARIO 2-18<br>The stem-and-leaf display below shows the

Q7: SCENARIO 2-4<br>A survey was conducted to determine

Q8: SCENARIO 2-9<br>The frequency distribution below represents the

Q9: To determine the width of class interval,divide

Q10: In graphing two categorical data,the side-by-side bar

Q11: SCENARIO 2-6<br>A sample of 200 students at

Examlex

ExamLex

About UsContact UsPerks CenterHomeschoolingTest Prep

Work With Us

Campus RepresentativeInfluencers

Links

FaqPricingChrome Extension

Download The App

Get App StoreGet Google Play

Policies

Privacy PolicyTerms of ServiceHonor CodeCommunity Guidelines

Scan To Download

qr-code

Copyright © (2025) ExamLex LLC.

Privacy PolicyTerms Of ServiceHonor CodeCommunity Guidelines