Multiple Choice
SCENARIO 19-3
A quality control analyst for a light bulb manufacturer is concerned that the time it takes to produce a batch of light bulbs is too erratic.Accordingly,the analyst randomly surveys 10 production periods each day for 14 days and records the sample mean and range for each day.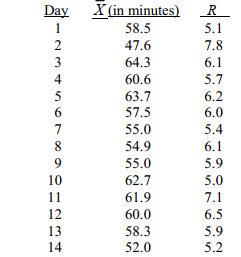
-Referring to Scenario 19-3,suppose the sample mean and range data were based on 11 observations per day instead of 10.How would this change affect the lower and upper control limits of the R chart?
A) LCL would increase;UCL would decrease.
B) LCL would remain the same;UCL would decrease.
C) Both LCL and UCL would remain the same.
D) LCL would decrease;UCL would increase.
Correct Answer:

Verified
Correct Answer:
Verified
Q72: SCENARIO 19-4<br>A factory supervisor is concerned that
Q73: Common causes of variation represent variation due
Q74: SCENARIO 19-3<br>A quality control analyst for a
Q75: A capability index is used to measure
Q76: Which famous statistician developed the 14 Points
Q78: Which of the following is true regarding
Q79: SCENARIO 19-8<br>Recently,a university switched to a new
Q80: SCENARIO 19-9<br>The manufacturer of canned food constructed
Q81: SCENARIO 19-8<br>Recently,a university switched to a new
Q82: Larger C<sub>pk</sub> indicates larger capability of meeting