Multiple Choice
The figure given below illustrates the market for British pounds. D£ and S£ are the demand and supply curves of the British pounds respectively. 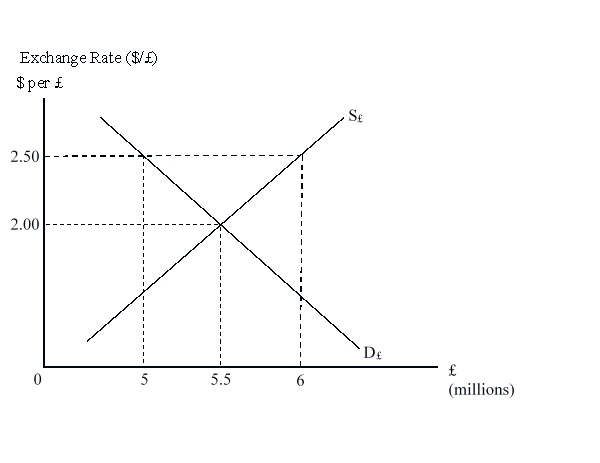 A downward movement along the vertical axis would correspond to a(n) _____ of the U.S. dollar.
A) arbitrage
B) swap
C) appreciation
D) depreciation
Correct Answer:

Verified
Correct Answer:
Verified
Q33: How can one profit through arbitrage if
Q34: Government officials wanting to defend a fixed
Q35: In a floating exchange rate system, the
Q36: The figure given below illustrates the market
Q37: Under the floating exchange rate system, a
Q39: Greece was among the 11 EU countries
Q40: Which of the following is true of
Q41: Which of the following groups is most
Q42: Shifts in demand away from French products
Q43: As the value of the yen falls