Multiple Choice
The figure given below illustrates the market for British pounds. D£ and S£ are the demand and supply curves of the British pounds respectively. 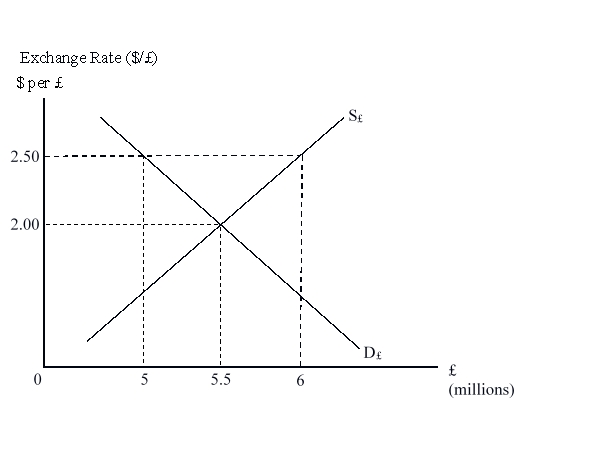 At an exchange rate of $2.50 per pound, there is an:
A) excess demand for 1 million pounds.
B) excess supply of 1 million pounds.
C) excess demand for 0.5 million pounds.
D) excess supply of 0.5 million pounds.
Correct Answer:

Verified
Correct Answer:
Verified
Q31: Arbitrage ensures that the spot price of
Q32: The spot exchange rate is the current
Q33: How can one profit through arbitrage if
Q34: Government officials wanting to defend a fixed
Q35: In a floating exchange rate system, the
Q37: Under the floating exchange rate system, a
Q38: The figure given below illustrates the market
Q39: Greece was among the 11 EU countries
Q40: Which of the following is true of
Q41: Which of the following groups is most