Multiple Choice
The figure given below represents the effects in the labor markets due to migration. Here the world has been divided into a high-income "North" (left panel) and a low-income "South" (right panel) . Dn and Sn are the labor demand and the labor supply curves in North. Ds and (Sr + Smig) are the labor demand and pre-migration labor supply curves in South. Sr is the post-migration labor supply curve in South. The value c is the cost of migrating. 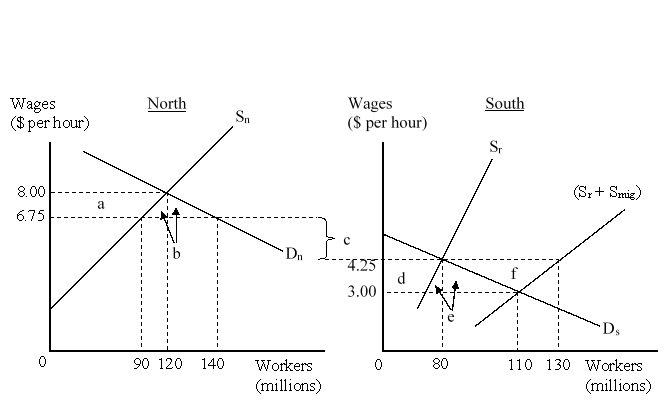 The net gain to the migrants is represented by the area:
A) (a + b) .
B) (e + f) .
C) (d + e) .
D) (a + f) .
Correct Answer:

Verified
Correct Answer:
Verified
Q44: The figure given below represents the effects
Q45: Foreign Direct Investment is used for all
Q46: It is easier to transfer capital from
Q47: Which of the following provides a good
Q48: Which of the following refers to transfer
Q50: Trade among parent and affiliates engaged in
Q51: What factors should be considered in determining
Q52: Concern about the ability of independent foreign
Q53: Which of the following is an inherent
Q54: Multinational enterprises use transfer pricing to:<br>A)lower prices