Multiple Choice
In the figure given below AB is the production-possibility curve of Canada. In the absence of trade, the price ratio is 1 bushel of wheat/bale of cotton as shown by the line PQ. The international price ratio is 0.25 bushels of wheat/bale of cotton as shown by the line RS. I1 and I2 are the pre-trade and the post trade community indifference curves of Canada respectively. After Canada engages in free trade, it will: 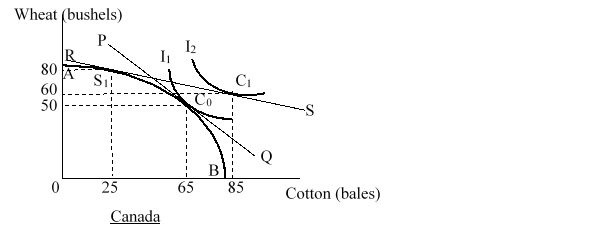
A) produce at point S1 and consume at point C1.
B) produce and consume at point C0.
C) produce at point S1 and consume at point C0.
D) produce and consume at point C1.
Correct Answer:

Verified
Correct Answer:
Verified
Q28: As a country moves up along its
Q29: In the figure given below AB is
Q30: The table given below shows the
Q31: Assume a two-country two-good two-input model where
Q32: The production-possibility curve alone does not provide
Q34: "In the two-good, two-country model with increasing
Q35: Explain why the Heckscher-Ohlin model predicts only
Q36: Consider a two-country two-good model where labor
Q37: Country Y has 15 thousand acres of
Q38: After the North American Free Trade Agreement