Multiple Choice
In the figure given below AB is the production-possibility curve of Canada. In the absence of trade, the price ratio is 1 bushel of wheat/bale of cotton as shown by the line PQ. The international price ratio is 0.25 bushels of wheat/bale of cotton as shown by the line RS. I1 and I2 are the pre-trade and the post trade community indifference curves of Canada respectively. Which of the following can be inferred from this figure? 
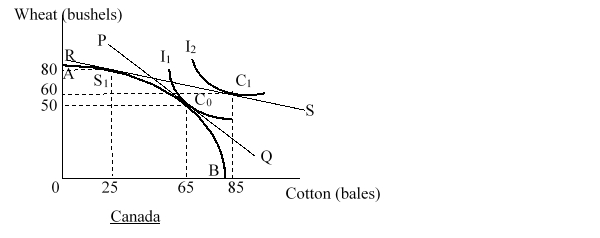
A) Canada has a comparative advantage in the production of wheat.
B) Canada has a comparative advantage in the production of cotton.
C) Canada has an absolute disadvantage in the production of both the goods.
D) Canada has absolute advantage in the production of both the goods.
Correct Answer:

Verified
Correct Answer:
Verified
Q24: Assume a two-country two-good two-input model where
Q25: Assume a two-country two-good two-input model where
Q26: The figure given below shows the post-trade
Q27: Assume a two-country two-good two-input model where
Q28: As a country moves up along its
Q30: The table given below shows the
Q31: Assume a two-country two-good two-input model where
Q32: The production-possibility curve alone does not provide
Q33: In the figure given below AB is
Q34: "In the two-good, two-country model with increasing