Multiple Choice
The figure given below shows the production-possibility curves of Canada (AB) and the Rest of the World (CD) . The pre-trade price ratio in Canada and the Rest of the World are given by the lines P1 and P3 respectively. The international price ratio faced by the countries is represented by the line P2. I?1 and I2 are the pre-trade and post-trade social indifference curves for both Canada and the Rest of the World respectively. In the absence of trade, Canada consumes _____ bales of cotton and _____ bushels of wheat. 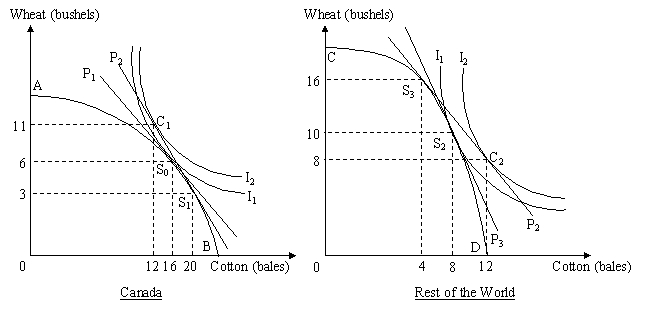
A) 20; 3
B) 16; 6
C) 20; 6
D) 12; 11
Correct Answer:

Verified
Correct Answer:
Verified
Q16: The production-possibility curve illustrates the consumption preferences
Q17: Assume a two-country, two-good, and two-input model.
Q18: Assume a two-country two-good two-input model where
Q19: Which of the following economists proposed an
Q20: Which of the following best explains why
Q22: Assume a two-country two-good two-input model. Let
Q23: In a two-country two-good model, the opening
Q24: Assume a two-country two-good two-input model where
Q25: Assume a two-country two-good two-input model where
Q26: The figure given below shows the post-trade