Multiple Choice
The table below gives beverage preferences for random samples of teens and adults. 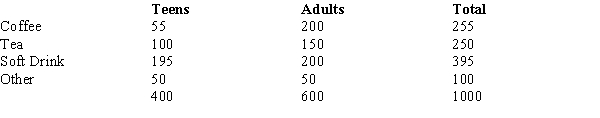 We are asked to test for independence between age (i.e., adult and teen) and drink preferences. The expected number of adults who prefer coffee is
A) 153.
B) 255.
C) 150.
D) 200.
Correct Answer:

Verified
Correct Answer:
Verified
Related Questions
Q49: The following table shows the number of
Q50: You want to test whether or not
Q51: Shown below is 3 x 2 table
Q52: You want to test whether or not
Q53: Last school year, the student body of
Q54: The following data show the scores of
Q55: Last school year, the student body of
Q57: From a poll of 800 television viewers,
Q58: The table below gives beverage preferences for
Q59: The test for goodness of fit<br>A) is