Essay
Shown below is 3 x 2 table with observed values from a sample of 1500. At the 5% level of significance, test for independence of the row and column factors. 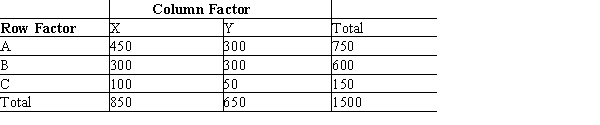
Correct Answer:

Verified
χ2 = 20.36; p-value i...View Answer
Unlock this answer now
Get Access to more Verified Answers free of charge
Correct Answer:
Verified
χ2 = 20.36; p-value i...
View Answer
Unlock this answer now
Get Access to more Verified Answers free of charge
Related Questions
Q46: In the past, 35% of the students
Q47: When individuals in a sample of 150
Q48: An insurance company has gathered the following
Q49: The following table shows the number of
Q50: You want to test whether or not
Q52: You want to test whether or not
Q53: Last school year, the student body of
Q54: The following data show the scores of
Q55: Last school year, the student body of
Q56: The table below gives beverage preferences for