Essay
The frequency distribution below was constructed from data collected on the quarts of soft drinks consumed per week by 20 students. 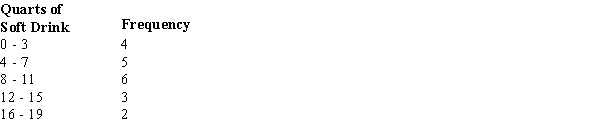
a.
Construct a relative frequency distribution.
b.
Construct a cumulative frequency distribution.
c.
Construct a cumulative relative frequency distribution.
Correct Answer:

Verified
Correct Answer:
Verified
Q5: In a stem-and-leaf display,<br>A) a single digit
Q6: Which of the following is least useful
Q7: Below you are given the examination scores
Q8: A tabular summary of a set of
Q9: In quality control applications, bar charts are
Q11: A display used to compare the frequency,
Q12: A sample of fifteen 7-year old boys
Q13: The sum of the percent frequencies for
Q14: A survey of 800 college seniors resulted
Q15: In a crosstabulation<br>A) both variables must be