Multiple Choice
A survey of 800 college seniors resulted in the following crosstabulation regarding their undergraduate major and whether or not they plan to go to graduate school. 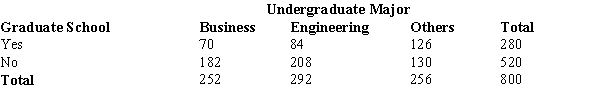 The above crosstabulation shows
A) frequencies.
B) row percentages.
C) column percentages.
D) overall percentages.
Correct Answer:

Verified
Correct Answer:
Verified
Q9: In quality control applications, bar charts are
Q10: The frequency distribution below was constructed from
Q11: A display used to compare the frequency,
Q12: A sample of fifteen 7-year old boys
Q13: The sum of the percent frequencies for
Q15: In a crosstabulation<br>A) both variables must be
Q16: The frequency distribution below was constructed from
Q17: The total number of data items with
Q18: A histogram is<br>A) a graphical presentation of
Q19: The sum of frequencies for all classes