Multiple Choice
Which of the following energy diagrams best represents the changes in energy during addition of HBr to an alkene? 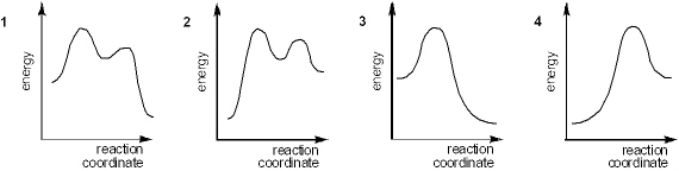
A) 1
B) 2
C) 3
D) 4
Correct Answer:

Verified
Correct Answer:
Verified
Related Questions
Q4: Which set of curved arrows accounts for
Q7: Which of the following is present in
Q8: Which of the following terms describes the
Q9: Use curved arrows to show the movement
Q10: Which species is the conjugate acid in
Q28: Which of the following is a feature
Q31: Which of the following is the strongest
Q47: Which of the following is a feature
Q51: Which of the following is a definition
Q80: What is the approximate pK<sub>a</sub> value of