Multiple Choice
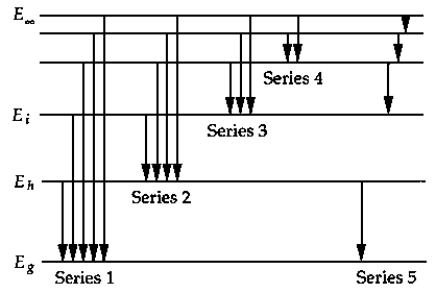 The above figure shows a schematic energy-level diagram for the hydrogen atom. The series that represents the Balmer series is
A) 1.
B) 2.
C) 3.
D) 4.
E) 5.
Correct Answer:

Verified
Correct Answer:
Verified
Q11: The critical experiments that established the nuclear
Q70: Light falling on the surface of a
Q135: Magnetic resonance imaging MRI) is a much-used
Q136: The constant in the Rydberg formula is
Q137: <img src="https://d2lvgg3v3hfg70.cloudfront.net/TB7291/.jpg" alt=" The figure shows
Q139: Estimate the number of photons emitted by
Q141: <img src="https://d2lvgg3v3hfg70.cloudfront.net/TB7291/.jpg" alt=" The graph shows
Q142: The energy of an x-ray photon of
Q143: <img src="https://d2lvgg3v3hfg70.cloudfront.net/TB7291/.jpg" alt=" The set of
Q145: The radii of the Bohr orbits in