Essay
One of the "media messages" sent by television is that appearance is a very important aspect of one's being. These messages are thought to spur young women to have unrealistic expectations about beauty, thus spending billions of dollars on cosmetics and toiletries. Some of these messages were studied during the 1999-2000 prime-time television season, when investigators kept track of the "appearance" comments. Some of their data, comments by males, classified by gender of recipient and type of appearance comment, is reproduced in the table below. 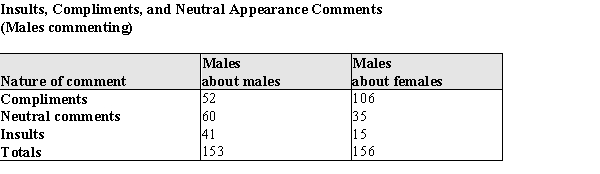 (a) Construct two pie charts, one for comments about males, one for comments about females, to summarize the data above. (b) Using the information in the table above and the pie charts in part (a), display the given information in a comparative bar chart. In the same study of appearance comments mentioned, comments by females were tabulated. That data appears below:
 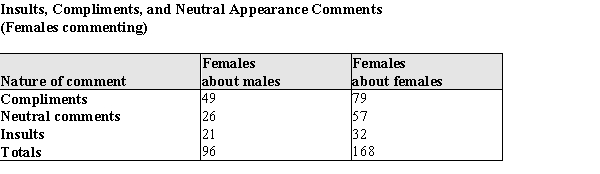 (c) Display these data in a segmented bar chart to compare the distribution of comments in these two samples. (d) Based on the information from the graphs in parts (a) - (c), how do the distributions differ when men rather than women are making the comments, and how do they differ when men rather than women are the recipients of the comments?
Correct Answer:

Verified
a) Comparative pie charts for comments a...View Answer
Unlock this answer now
Get Access to more Verified Answers free of charge
Correct Answer:
Verified
View Answer
Unlock this answer now
Get Access to more Verified Answers free of charge
Q12: A student conducted a survey among different
Q13: Ruminants are hoofed animals such as cattle
Q14: Each year Anna conducts a poll among
Q15: For stem and leaf plots with single-digit
Q16: A pie chart is most useful for
Q18: Consider the time series plot. Determine what
Q19: The density of a class can be
Q20: A curve with tails that decline more
Q21: The quantity <img src="https://d2lvgg3v3hfg70.cloudfront.net/TB7678/.jpg" alt="The quantity
Q22: Would you say that most lawyers in