Multiple Choice
Each year Anna conducts a poll among the children in a school in which she asks how many countries in Eastern Europe they know. The information from one poll has been used to estimate that during the first half of 2013, on average 5.25% of respondents could name at least 5 countries in Eastern Europe. Estimates for the years 2004 to 2017 are also provided, as shown in the accompanying table. 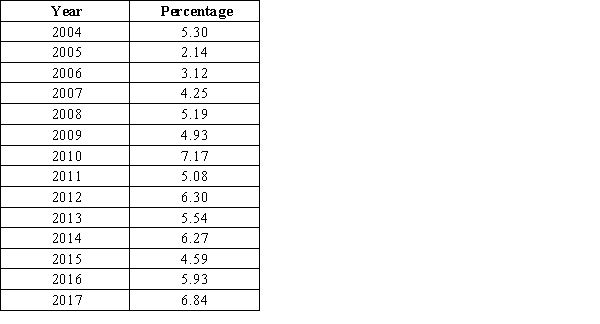 Having constructed a time series plot for these data, describe the trend in the percent of children who could name at least 5 countries in Eastern Europe over time.
A) The time series plot shows that the percentage has steadily increased year to year.
B) The time series plot shows that the percentage has not steadily increased year to year, although there does appear to be a general upward trend following the drop that occurred in 2005.
C) The time series plot shows that the percentage has not steadily decreased year to year, although there does appear to be a general downward trend following the rise that occurred in 2010.
D) The time series plot shows that the percentage has steadily decreased year to year.
Correct Answer:

Verified
Correct Answer:
Verified
Q9: Each person in a sample of 800
Q10: If the upper tail of a distribution
Q11: Investigators writing in the Journal of Early
Q12: A student conducted a survey among different
Q13: Ruminants are hoofed animals such as cattle
Q15: For stem and leaf plots with single-digit
Q16: A pie chart is most useful for
Q17: One of the "media messages" sent by
Q18: Consider the time series plot. Determine what
Q19: The density of a class can be