Essay
As part of the United States Census, data is also collected on the number of persons in each household. The census data for four decades is summarized below. 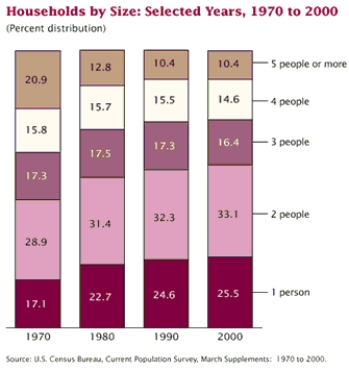 (a) In a few sentences describe how the proportion of households with 4 people has changed from 1970 to 2000. (b) What size of household appears to have decreased the most from 1970 to 2000?
Correct Answer:

Verified
a) The proportion of households with 4 p...View Answer
Unlock this answer now
Get Access to more Verified Answers free of charge
Correct Answer:
Verified
View Answer
Unlock this answer now
Get Access to more Verified Answers free of charge
Q15: For stem and leaf plots with single-digit
Q16: A pie chart is most useful for
Q17: One of the "media messages" sent by
Q18: Consider the time series plot. Determine what
Q19: The density of a class can be
Q20: A curve with tails that decline more
Q21: The quantity <img src="https://d2lvgg3v3hfg70.cloudfront.net/TB7678/.jpg" alt="The quantity
Q22: Would you say that most lawyers in
Q24: In a scatter plot, both the horizontal
Q25: In 1986 marine biologists reported the discovery