Multiple Choice
Figure 21-22 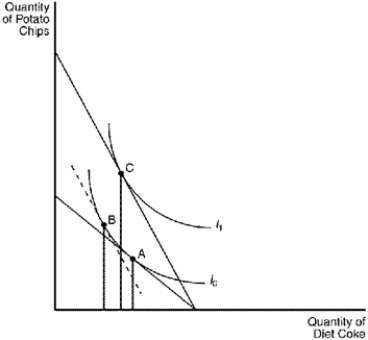
-Refer to Figure 21-22. The shift from point B to point C in the figure is due to the
A) substitution effect of an increase in the price of potato chips.
B) income effect of an increase in the price of potato chips.
C) substitution effect of a decrease in the price of potato chips.
D) income effect of a decrease in the price of potato chips.
Correct Answer:

Verified
Correct Answer:
Verified
Q124: The indifference curves for perfect substitutes are
Q360: Figure 21-2 The downward-sloping line on the
Q361: A budget constraint shows<br>A)the maximum utility that
Q362: Figure 21-13 <img src="https://d2lvgg3v3hfg70.cloudfront.net/TB1273/.jpg" alt="Figure 21-13
Q363: Figure 21-19 <img src="https://d2lvgg3v3hfg70.cloudfront.net/TB1273/.jpg" alt="Figure 21-19
Q365: The following diagram shows two budget lines:
Q366: Scenario 21-4 Frank spends all of his
Q367: Grace consumes two goods: iced tea and
Q368: If the consumer's income and all prices
Q369: Figure 21-5<br>(a)<br>(b) <img src="https://d2lvgg3v3hfg70.cloudfront.net/TB1273/.jpg" alt="Figure 21-5 (a)