Multiple Choice
The following diagram shows two budget lines: A and B. 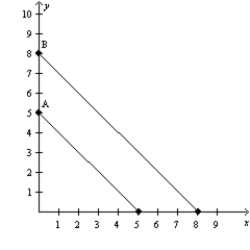 Which of the following could explain the change in the budget line from A to B?
A) a simultaneous decrease in the price of X and the price of Y
B) an increase in income
C) a decrease in income and a decrease in the price of Y
D) Both a and b are correct.
Correct Answer:

Verified
Correct Answer:
Verified
Q27: The rate at which a consumer is
Q360: Figure 21-2 The downward-sloping line on the
Q361: A budget constraint shows<br>A)the maximum utility that
Q362: Figure 21-13 <img src="https://d2lvgg3v3hfg70.cloudfront.net/TB1273/.jpg" alt="Figure 21-13
Q363: Figure 21-19 <img src="https://d2lvgg3v3hfg70.cloudfront.net/TB1273/.jpg" alt="Figure 21-19
Q364: Figure 21-22 <img src="https://d2lvgg3v3hfg70.cloudfront.net/TB1273/.jpg" alt="Figure 21-22
Q366: Scenario 21-4 Frank spends all of his
Q367: Grace consumes two goods: iced tea and
Q368: If the consumer's income and all prices
Q369: Figure 21-5<br>(a)<br>(b) <img src="https://d2lvgg3v3hfg70.cloudfront.net/TB1273/.jpg" alt="Figure 21-5 (a)