Multiple Choice
Figure 21-23 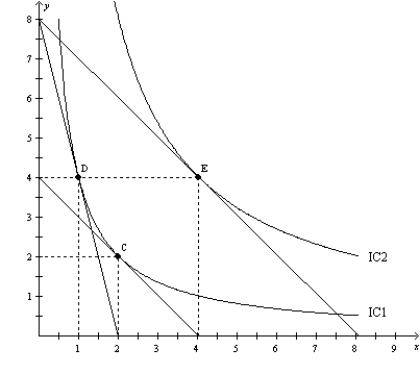
-Refer to Figure 21-23. When the price of X is $80, the price of Y is $20, and the consumer's income is $160, the consumer's optimal choice is D. Then the price of X decreases to $20. The substitution effect can be illustrated as the movement from
A) D to E.
B) D to C.
C) C to E.
D) E to D.
Correct Answer:

Verified
Correct Answer:
Verified
Q150: A budget constraint illustrates bundles that a
Q534: Figure 21-3<br>In each case, the budget constraint
Q535: When indifference curves are bowed in toward
Q536: A decrease in a consumer's income<br>A)increases the
Q537: A consumer maximizes utility when she consumes
Q538: If Suzette responds to an increase in
Q541: The following diagram shows a budget constraint
Q542: When Matt has an income of $2,000,
Q543: Utility measures the<br>A)income a consumer receives from
Q544: Suppose that Sam likes pears twice as