Multiple Choice
Figure 21-3
In each case, the budget constraint moves from BC-1 to BC-2. 
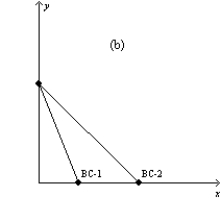
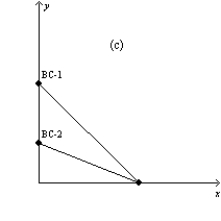
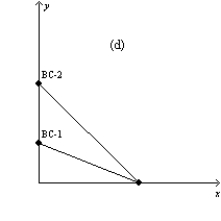
-Refer to Figure 21-3. Which of the graphs in the figure could reflect a simultaneous decrease in the price of good X and increase in the price of good Y? (i)
Graph a
(ii)
Graph b
(iii)
Graph c
(iv)
Graph d
A) (ii) only
B) (iii) only
C) (ii) or (iv) only
D) None of the above is correct.
Correct Answer:

Verified
Correct Answer:
Verified
Q167: Table 21-3<br><br>Ethan consumes two goods, milk
Q529: Assume that a consumer faces the following
Q530: Figure 21-31 The figure shows two indifference
Q532: When a consumer experiences a price decrease
Q533: Good X is an inferior good but
Q535: When indifference curves are bowed in toward
Q536: A decrease in a consumer's income<br>A)increases the
Q537: A consumer maximizes utility when she consumes
Q538: If Suzette responds to an increase in
Q539: Figure 21-23 <img src="https://d2lvgg3v3hfg70.cloudfront.net/TB1273/.jpg" alt="Figure 21-23