Multiple Choice
Figure 21-25 The figure pertains to a particular consumer. On the axes, X represents the quantity of good X and Y represents the quantity of good Y. 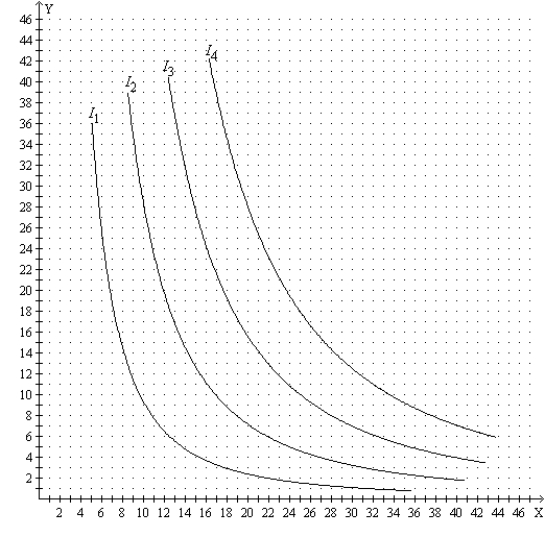
-Refer to Figure 21-25. Suppose the price of good X is $10, the price of good Y is $5, and the consumer's income is $210. Then the consumer's optimal choice is represented by a point on which curve?
A) I1
B) I2
C) I3
D) I4
Correct Answer:

Verified
Correct Answer:
Verified
Q20: Gerald spends his weekly income on gin
Q22: Figure 21-14 <img src="https://d2lvgg3v3hfg70.cloudfront.net/TB1273/.jpg" alt="Figure 21-14
Q23: Figure 21-4<br>In each case, the budget constraint
Q24: The marginal rate of substitution is<br>A)the slope
Q26: Figure 21-14 <img src="https://d2lvgg3v3hfg70.cloudfront.net/TB1273/.jpg" alt="Figure 21-14
Q27: Figure 21-8 <img src="https://d2lvgg3v3hfg70.cloudfront.net/TB1273/.jpg" alt="Figure 21-8
Q28: Figure 21-11 <img src="https://d2lvgg3v3hfg70.cloudfront.net/TB1273/.jpg" alt="Figure 21-11
Q29: Consider the indifference curve map and budget
Q173: Suppose a consumer spends her income on
Q187: Scenario 21-3<br>Scott knows that he will ultimately