Multiple Choice
Figure 21-14 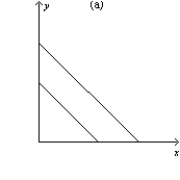
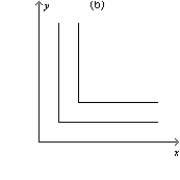
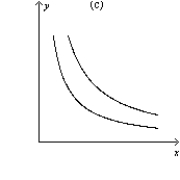
-Refer to Figure 21-14. Which of the graphs illustrates indifference curves for which the marginal rate of substitution is constant?
A) graph a
B) graph b
C) graph c
D) All of the above are correct.
Correct Answer:

Verified
Correct Answer:
Verified
Q22: Figure 21-14 <img src="https://d2lvgg3v3hfg70.cloudfront.net/TB1273/.jpg" alt="Figure 21-14
Q23: Figure 21-4<br>In each case, the budget constraint
Q24: The marginal rate of substitution is<br>A)the slope
Q25: Figure 21-25 The figure pertains to a
Q27: Figure 21-8 <img src="https://d2lvgg3v3hfg70.cloudfront.net/TB1273/.jpg" alt="Figure 21-8
Q28: Figure 21-11 <img src="https://d2lvgg3v3hfg70.cloudfront.net/TB1273/.jpg" alt="Figure 21-11
Q29: Consider the indifference curve map and budget
Q31: Preston goes to the movies every Sunday
Q173: Suppose a consumer spends her income on
Q187: Scenario 21-3<br>Scott knows that he will ultimately