Multiple Choice
Figure 21-15 On the graph, Qx represents the quantity of good x and Qy represents the quantity of good y. The lines drawn on the graph represent three of Barbara's indifference curves. 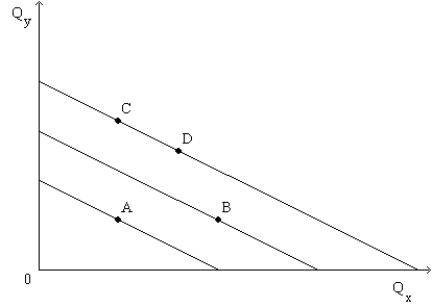
-Refer to Figure 21-15. For Barbara, the marginal rate of substitution between goods y and x
A) increases as she moves downward and to the right along one of her indifference curves.
B) decreases as she moves downward and to the right along one of her indifference curves.
C) remains constant as she moves downward and to the right along one of her indifference curves.
D) is undefined for any movement along any one of her indifference curves.
Correct Answer:

Verified
Correct Answer:
Verified
Q310: Figure 21-12 <img src="https://d2lvgg3v3hfg70.cloudfront.net/TB1273/.jpg" alt="Figure 21-12
Q311: Figure 21-30 The graph shows two budget
Q312: Figure 21-5<br>(a)<br>(b) <img src="https://d2lvgg3v3hfg70.cloudfront.net/TB1273/.jpg" alt="Figure 21-5 (a)
Q313: Figure 21-21 <img src="https://d2lvgg3v3hfg70.cloudfront.net/TB1273/.jpg" alt="Figure 21-21
Q314: Figure 21-32 The figure shows three indifference
Q316: Jordan is planning ahead for retirement and
Q317: Figure 21-3<br>In each case, the budget constraint
Q318: Which of the following statements is necessarily
Q319: Figure 21-25 The figure pertains to a
Q320: Suppose Caroline is indifferent between tea and