Essay
Figure 21-30 The graph shows two budget constraints for a consumer. 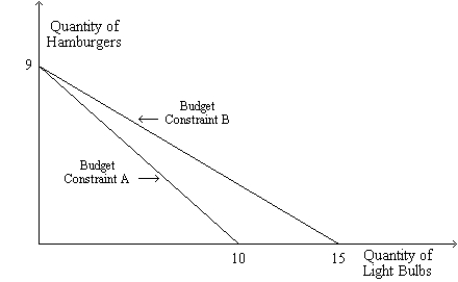
-Refer to Figure 21-30. Suppose the price of a hamburger is $10 and Budget Constraint A applies. What is the consumer's income? What is the price of a light bulb?
Correct Answer:

Verified
The consumer's incom...View Answer
Unlock this answer now
Get Access to more Verified Answers free of charge
Correct Answer:
Verified
View Answer
Unlock this answer now
Get Access to more Verified Answers free of charge
Q306: Figure 21-3<br>In each case, the budget constraint
Q307: The theory of consumer choice illustrates the<br>A)importance
Q308: Figure 21-29<br>The figure below illustrates the preferences
Q309: Scenario 21-1<br>Suppose the price of hot wings
Q310: Figure 21-12 <img src="https://d2lvgg3v3hfg70.cloudfront.net/TB1273/.jpg" alt="Figure 21-12
Q312: Figure 21-5<br>(a)<br>(b) <img src="https://d2lvgg3v3hfg70.cloudfront.net/TB1273/.jpg" alt="Figure 21-5 (a)
Q313: Figure 21-21 <img src="https://d2lvgg3v3hfg70.cloudfront.net/TB1273/.jpg" alt="Figure 21-21
Q314: Figure 21-32 The figure shows three indifference
Q315: Figure 21-15 On the graph, Q<sub>x</sub> represents
Q316: Jordan is planning ahead for retirement and