Multiple Choice
Figure 21-2 The downward-sloping line on the figure represents a consumer's budget
constraint. 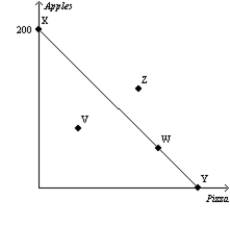
-Refer to Figure 21-2. If the consumer's income is $100, then what is the price of an apple?
A) $0.50
B) $0.75
C) $1.00
D) $1.25
Correct Answer:

Verified
Correct Answer:
Verified
Q47: A consumer's indifference curves are right angles
Q114: "Left" gloves and "right" gloves provide a
Q209: Consumers face tradeoffs except at the point
Q409: Higher indifference curves are preferred to lower
Q410: The bowed shape of the indifference curve
Q411: Figure 21-22 <img src="https://d2lvgg3v3hfg70.cloudfront.net/TB1273/.jpg" alt="Figure 21-22
Q413: Suppose the price of good X falls
Q415: If income decreases and prices are unchanged,
Q418: Consider two goods: peanuts and crackers. The
Q419: Figure 21-3<br>In each case, the budget constraint