Multiple Choice
Figure 21-3
In each case, the budget constraint moves from BC-1 to BC-2. 
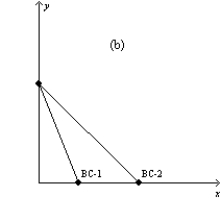
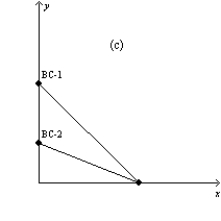
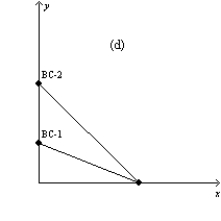
-Refer to Figure 21-3. Which of the graphs in the figure reflects an increase in the price of good Y only?
A) graph a
B) graph b
C) graph c
D) graph d
Correct Answer:

Verified
Correct Answer:
Verified
Related Questions
Q47: A consumer's indifference curves are right angles
Q144: If a consumer purchases more of good
Q185: Thomas faces prices of $6 for a
Q209: Consumers face tradeoffs except at the point
Q414: Figure 21-2 The downward-sloping line on the
Q415: If income decreases and prices are unchanged,
Q418: Consider two goods: peanuts and crackers. The
Q421: Frannie spends her income on rice and
Q422: Bill consumes two goods: iced tea and
Q423: A consumer has preferences over two goods,