Multiple Choice
Figure 21-3
In each case, the budget constraint moves from BC-1 to BC-2. 
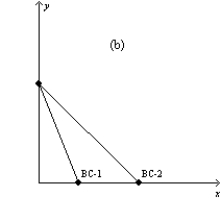
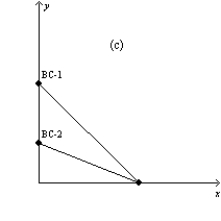
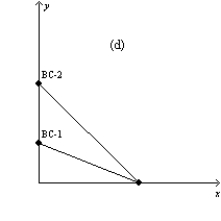
-Refer to Figure 21-3. Which of the graphs in the figure could reflect a simultaneous decrease in the prices of both goods? (i)
Graph a
(ii)
Graph b
(iii)
Graph c
(iv)
Graph d
A) (i) only
B) (iv) only
C) (ii) or (iii) only
D) None of the above is correct.
Correct Answer:

Verified
Correct Answer:
Verified
Q19: At a consumer's optimal choice, the consumer
Q301: Bundle J contains 10 units of good
Q302: Scenario 21-1<br>Suppose the price of hot wings
Q303: Which of the following is most likely
Q305: When considering her budget, the highest indifference
Q307: The theory of consumer choice illustrates the<br>A)importance
Q308: Figure 21-29<br>The figure below illustrates the preferences
Q309: Scenario 21-1<br>Suppose the price of hot wings
Q310: Figure 21-12 <img src="https://d2lvgg3v3hfg70.cloudfront.net/TB1273/.jpg" alt="Figure 21-12
Q311: Figure 21-30 The graph shows two budget