Multiple Choice
Figure 16-9
The figure is drawn for a monopolistically-competitive firm. 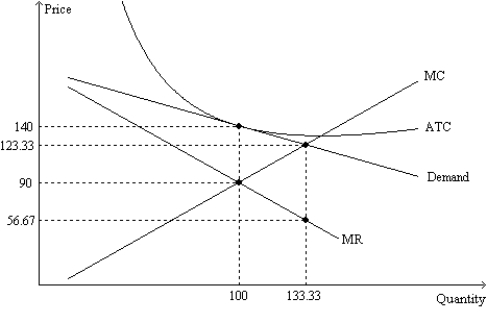
-Refer to Figure 16-9. The quantity of output at which the MC and ATC curves cross is the
A) efficient scale of the firm.
B) short-run equilibrium quantity of output for the firm.
C) long-run equilibrium quantity of output for the firm.
D) All of the above are correct.
Correct Answer:

Verified
Correct Answer:
Verified
Q233: Figure 16-14 <img src="https://d2lvgg3v3hfg70.cloudfront.net/TB1273/.jpg" alt="Figure 16-14
Q304: The debate over the efficiency of markets
Q306: Figure 16-12 <img src="https://d2lvgg3v3hfg70.cloudfront.net/TB1273/.jpg" alt="Figure 16-12
Q307: Advertisements that appear to convey no information
Q308: Which of the following statements is not
Q310: Figure 16-11 <img src="https://d2lvgg3v3hfg70.cloudfront.net/TB1273/.jpg" alt="Figure 16-11
Q311: Figure 16-3<br>This figure depicts a situation in
Q313: Table 16-1<br>The following table shows the percentage
Q314: Which of the following market structures results
Q536: Table 16-7<br>A monopolistically competitive firm faces the