Multiple Choice
Table 16-1
The following table shows the percentage of output supplied by the top eight firms in four different industries. 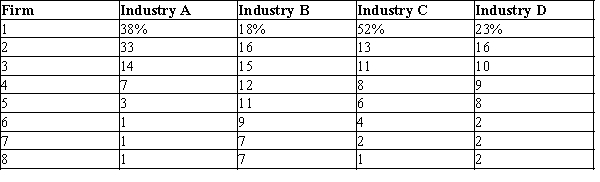
-Refer to Table 16-1. Which industry has the lowest concentration ratio?
A) Industry A
B) Industry B
C) Industry C
D) Industry D
Correct Answer:

Verified
Correct Answer:
Verified
Q308: Which of the following statements is not
Q309: Figure 16-9<br>The figure is drawn for a
Q310: Figure 16-11 <img src="https://d2lvgg3v3hfg70.cloudfront.net/TB1273/.jpg" alt="Figure 16-11
Q311: Figure 16-3<br>This figure depicts a situation in
Q314: Which of the following market structures results
Q315: Figure 16-11 <img src="https://d2lvgg3v3hfg70.cloudfront.net/TB1273/.jpg" alt="Figure 16-11
Q316: Table 16-7<br>A monopolistically competitive firm faces the
Q317: Table 16-4<br>This table shows the demand schedule,
Q318: Figure 16-12 <img src="https://d2lvgg3v3hfg70.cloudfront.net/TB1273/.jpg" alt="Figure 16-12
Q536: Table 16-7<br>A monopolistically competitive firm faces the