Multiple Choice
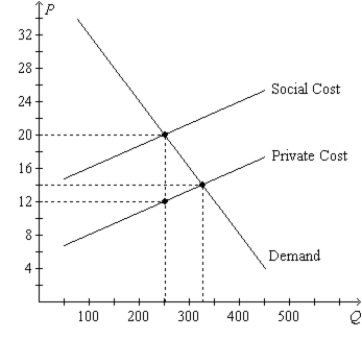
Figure 10-13. On the graph, Q represents the quantity of plastics and P represents the price of plastics. 
-Refer to Figure 10-13. In order to reach the social optimum, the government could
A) impose a tax of $2 per unit on plastics.
B) impose a tax of $6 per unit on plastics.
C) impose a tax of $8 per unit on plastics.
D) offer a subsidy of $6 per unit on plastics.
Correct Answer:

Verified
Correct Answer:
Verified
Q117: A corrective tax places a price on
Q154: Suppose the government levies a corrective tax
Q432: Figure 10-9 <img src="https://d2lvgg3v3hfg70.cloudfront.net/TB1273/.jpg" alt="Figure 10-9
Q433: If the social value of producing a
Q434: Figure 10-19 <img src="https://d2lvgg3v3hfg70.cloudfront.net/TB1273/.jpg" alt="Figure 10-19
Q435: In summarizing the research on the externalities
Q438: A positive externality will cause a market
Q439: In terms of their economic effects, which
Q440: Assume that your roommate is very messy.
Q441: Figure 10-8 <img src="https://d2lvgg3v3hfg70.cloudfront.net/TB1273/.jpg" alt="Figure 10-8