Multiple Choice
Figure 10-19 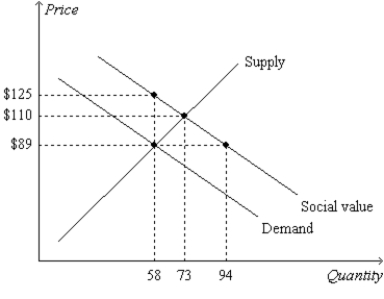
-Refer to Figure 10-19. Note that the lines labeled "Demand" and "Social Value"are parallel. Also, the slopes of the lines on the graph reflect the following facts: (1) Private value and social value decrease by $1.00 with each additional unit of the good that is consumed, and (2) private cost increases by $1.40 with each additional unit of the good that is produced. Thus, when the 59th unit of the good is produced and consumed, social well-being increases by
A) $28.00.
B) $31.40.
C) $33.60.
D) $36.00.
Correct Answer:

Verified
Correct Answer:
Verified
Q30: The Coase theorem asserts that private economic
Q117: A corrective tax places a price on
Q154: Suppose the government levies a corrective tax
Q187: Markets sometimes fail to allocate resources efficiently.
Q432: Figure 10-9 <img src="https://d2lvgg3v3hfg70.cloudfront.net/TB1273/.jpg" alt="Figure 10-9
Q433: If the social value of producing a
Q435: In summarizing the research on the externalities
Q436: Figure 10-13. On the graph, Q represents
Q438: A positive externality will cause a market
Q439: In terms of their economic effects, which