Multiple Choice
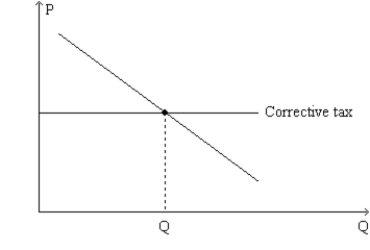
Figure 10-18. The graph represents a corrective tax to reduce pollution. On the axes, Q denotes the quantity of pollution and P represents the price of pollution. 
-Refer to Figure 10-18. The line labeled "Corrective tax" could accurately be re-labeled as
A) "Demand for clean air."
B) "Demand for pollution rights."
C) "Price of pollution."
D) "Rate of subsidy."
Correct Answer:

Verified
Correct Answer:
Verified
Q15: The supply curve for a product reflects
Q18: Figure 10-20. <img src="https://d2lvgg3v3hfg70.cloudfront.net/TB1273/.jpg" alt="Figure 10-20.
Q19: The Golden Rule is an example of
Q21: The requirement that a minimum volume of
Q22: According to the Coase theorem, private parties
Q25: Sophia sits behind Gabriel on an airplane.
Q42: Although regulation and corrective taxes are both
Q67: Using a supply and demand diagram, demonstrate
Q87: Assume each college degree that is granted
Q98: Suppose a certain good provides an external