Multiple Choice
Figure 10-20. 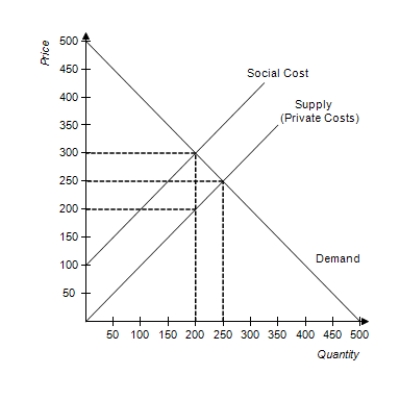
-Refer to Figure 10-20. The graph depicts the market for fertilizer. What is the socially optimal price of fertilizer?
A) $100
B) $200
C) $250
D) $300
Correct Answer:

Verified
Correct Answer:
Verified
Related Questions
Q14: With a corrective tax, the supply curve
Q15: The supply curve for a product reflects
Q19: The Golden Rule is an example of
Q20: Figure 10-18. The graph represents a corrective
Q21: The requirement that a minimum volume of
Q22: According to the Coase theorem, private parties
Q35: Most economists prefer regulation to taxation because
Q42: Although regulation and corrective taxes are both
Q87: Assume each college degree that is granted
Q98: Suppose a certain good provides an external