Multiple Choice
Figure 10-2. The graph depicts the market for plastic. 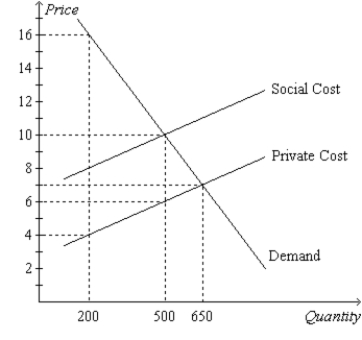
-Refer to Figure 10-2. The private value of the 200th unit of plastic exceeds the social cost of the 200th unit of plastic by
A) $4.
B) $8.
C) $12.
D) $16.
Correct Answer:

Verified
Correct Answer:
Verified
Q309: The difference between a corrective tax and
Q310: Table 10-5<br>The following table shows the marginal
Q311: Private markets fail to reach a socially
Q312: Figure 10-19 <img src="https://d2lvgg3v3hfg70.cloudfront.net/TB1273/.jpg" alt="Figure 10-19
Q313: Figure 10-11 <img src="https://d2lvgg3v3hfg70.cloudfront.net/TB1273/.jpg" alt="Figure 10-11
Q315: Figure 10-10 <img src="https://d2lvgg3v3hfg70.cloudfront.net/TB1273/.jpg" alt="Figure 10-10
Q316: Ty lives in an apartment building and
Q317: If we know that the demand curve
Q318: Figure 10-2. The graph depicts the market
Q319: Abe owns a dog; the dog's barking