Multiple Choice
Figure 10-10 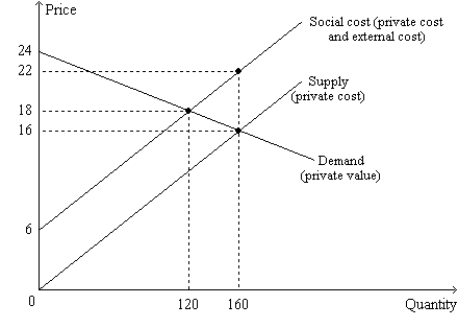
-Refer to Figure 10-10. The graph represents a market in which
A) there is no externality.
B) there is a positive externality.
C) there is a negative externality.
D) The answer cannot be determined from inspection of the graph.
Correct Answer:

Verified
Correct Answer:
Verified
Q55: Economists believe that the optimal level of
Q310: Table 10-5<br>The following table shows the marginal
Q311: Private markets fail to reach a socially
Q312: Figure 10-19 <img src="https://d2lvgg3v3hfg70.cloudfront.net/TB1273/.jpg" alt="Figure 10-19
Q313: Figure 10-11 <img src="https://d2lvgg3v3hfg70.cloudfront.net/TB1273/.jpg" alt="Figure 10-11
Q314: Figure 10-2. The graph depicts the market
Q316: Ty lives in an apartment building and
Q317: If we know that the demand curve
Q318: Figure 10-2. The graph depicts the market
Q319: Abe owns a dog; the dog's barking