Multiple Choice
Which one of the following is the best representation of the titration curve which will be obtained in the titration of a weak base (0.10 mol L¯1) with HCl of the same concentration?
A) 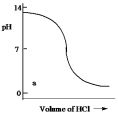
B) 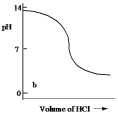
C) 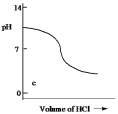
D) 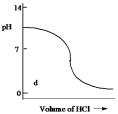
E) 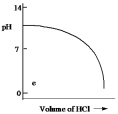
Correct Answer:

Verified
Correct Answer:
Verified
Related Questions
Q39: The salts X(NO<sub>3</sub>)<sub>2</sub> and Y(NO<sub>3</sub>)<sub>2</sub> (where X<sup>+</sup>
Q40: A buffer is prepared by adding 0.5
Q41: Calculate the solubility of magnesium sulfate, MgSO<sub>4</sub>,
Q44: A solution is prepared by mixing 50.0
Q45: The concentration of the complex ion in
Q46: Citric acid has an acid dissociation constant
Q47: What is the pH of a buffer
Q52: Use a carefully drawn and labeled diagram
Q103: Make a clear distinction between buffer range
Q105: A 50.0-mL sample of 0.50 M HCl