Multiple Choice
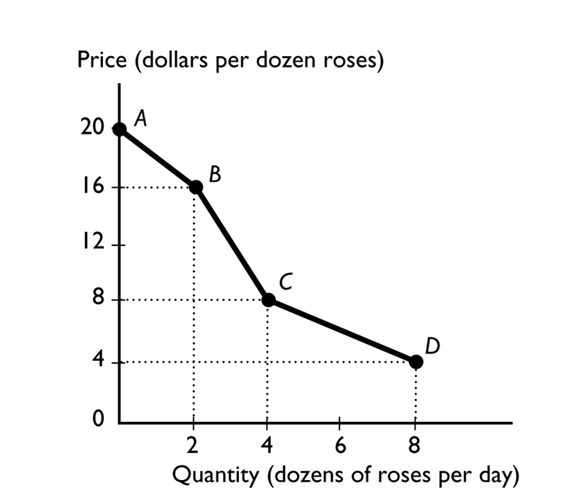
The figure above shows the relationship between the price of a dozen roses and the quantity of roses a florist can sell. The slope between points B and C equals
A) 4.
B) 8.
C) 14.
D) 16.
E) 2.
Correct Answer:

Verified
Correct Answer:
Verified
Q136: <span class="ql-formula" data-value="\begin{array} { c c }
Q137: In economics, cost is measured as<sub>--------------------</sub> ,
Q138: <img src="https://d2lvgg3v3hfg70.cloudfront.net/TB2787/.jpg" alt=" The figure above
Q139: <img src="https://d2lvgg3v3hfg70.cloudfront.net/TB2787/.jpg" alt=" The relationship between
Q140: The opportunity cost of a one-unit increase
Q142: When a third string NFL quarterback earns
Q143: Which of the following statements is a
Q144: To make a rational choice, a person<br>A)adds
Q145: <img src="https://d2lvgg3v3hfg70.cloudfront.net/TB2787/.jpg" alt=" In the
Q146: <img src="https://d2lvgg3v3hfg70.cloudfront.net/TB2787/.jpg" alt=" In the