Multiple Choice
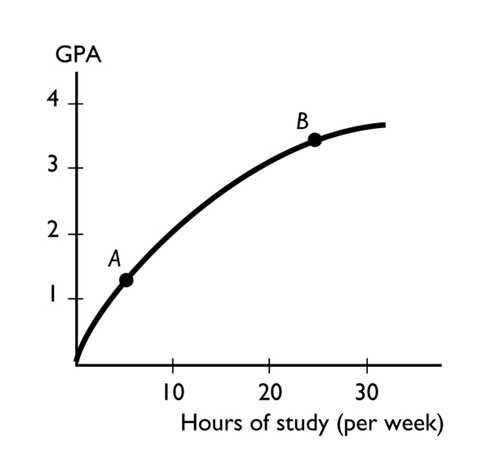
The figure above shows the relationship between the time a student spends studying and the student's GPA that semester. The slope of the relationship at point A -------------------- the slope at point B.
A) is less than
B) is equal to
C) is greater than
D) cannot be compared to
E) can be compared but more information is needed to determine whether the slope is greater than, less than, or equal to
Correct Answer:

Verified
Correct Answer:
Verified
Q133: The cost of a one-unit increase in
Q134: Which of the following is true?<br>I. A
Q135: Trend refers to<br>A)a general tendency for a
Q136: <span class="ql-formula" data-value="\begin{array} { c c }
Q137: In economics, cost is measured as<sub>--------------------</sub> ,
Q139: <img src="https://d2lvgg3v3hfg70.cloudfront.net/TB2787/.jpg" alt=" The relationship between
Q140: The opportunity cost of a one-unit increase
Q141: <img src="https://d2lvgg3v3hfg70.cloudfront.net/TB2787/.jpg" alt=" The figure above
Q142: When a third string NFL quarterback earns
Q143: Which of the following statements is a